Adam Scott, MS, CSCS
After publishing our Five Rules of Rucking article, we went ahead and re-tested it. We did this in order to determine the true effect of uphill movement on speed. The article debunked the rule that a 10% grade would decrease an athlete’s speed by 50%…it turned out to be closer to 33%.
Then we set out to test another rule – the effect of load on speed. Officially, here is the rule we were testing: 1% BW adds 6 seconds per mile.
DESIGN
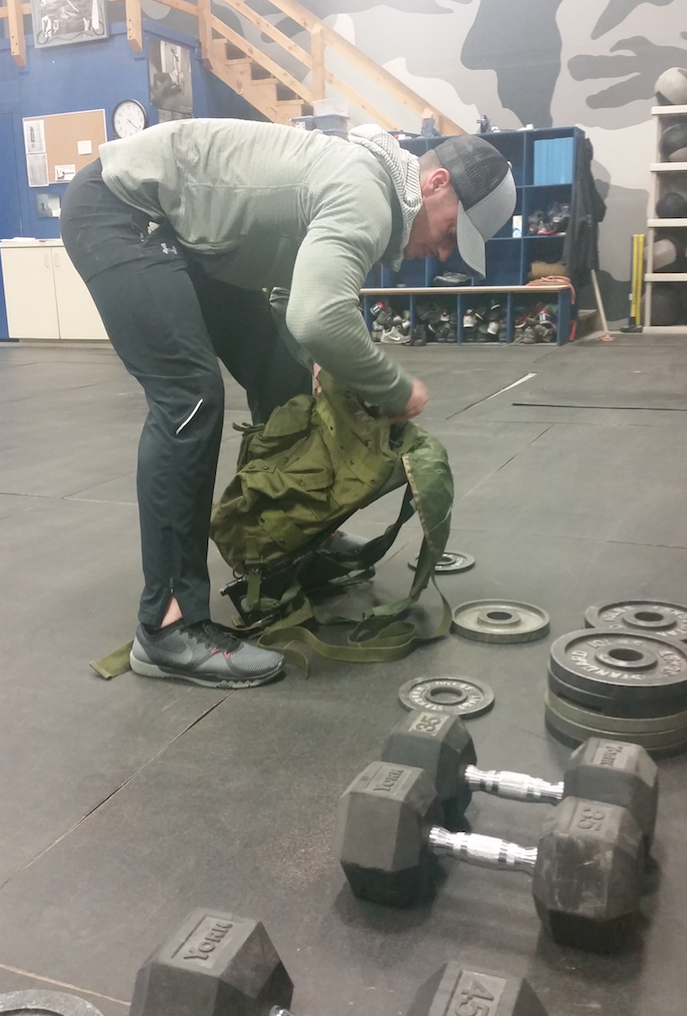
To test the rule we developed two simple experiments using our lab rats, rucks and treadmills. The experiments were identical except one was completed at an incline and the other was not.
Step 1: Utilizing previous research from the US Army and our earlier experiences we settled on eight loads: 0#, 17.5#, 35#, 52.5#, 70#, 87.5#, 105#, 122.5# (1,2). Lat rat weights varied from 170# to 205#. Thus, loads ranged from 9% and 70% of a lab rat’s body weight.
Step 2: Lab rats completed eight horizontal trials – one at each load. All time-trials lasted 4 minutes; during which speed and HR were assessed. For the horizontal trials, the initial, unloaded speed was 4.0mph and 1% incline.
Step 3: After their 4 minutes of walking the lab rats were given a 3-minute break, during which they added weight to their rucks. After adding the weight, our lab rats completed another 4-minute trial at the assigned weight (weights were randomly ordered).
Step 4: The following day our Lab rats repeat steps 2-4, but on a 15% incline. For the incline trials, the initial, unloaded speed was 2.1mph (based on MTI previous research).
Thus, on day 2 our athletes had to walk at a 15% incline at the same HR while carrying either 0#, 17.5#, 35#, 52.5#, 70#, 87.5#, 105# or 122.5# and we recorded their speed.
Step 5: Since the athlete’s HRs were roughly the same at each load (+/- 4.8 BPM) we compared their speeds to determine the effect that the load had on their velocity.
RESULTS AND DISCUSSIONS
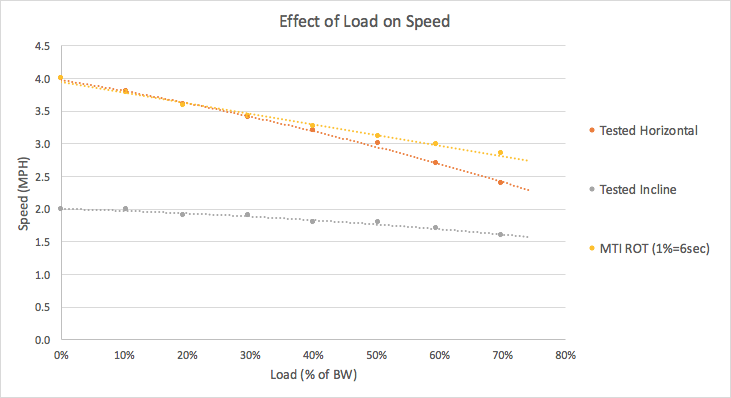
GRAPH 1: Effect of Load on Speed

As the graph above shows, in loads over 40% BW the linear relationship between speed and load breaks-down. Over 40% BW speed becomes much more drastically affected by additional weight. This finding was similar to what Deuster et al. reported in their 1997 U.S. military report (3). Based on their findings Duster et al. recommended a maximum load of 40% of BW. The researchers also found that at loads over 50% BW the athlete’s gaits were drastically affected by load.
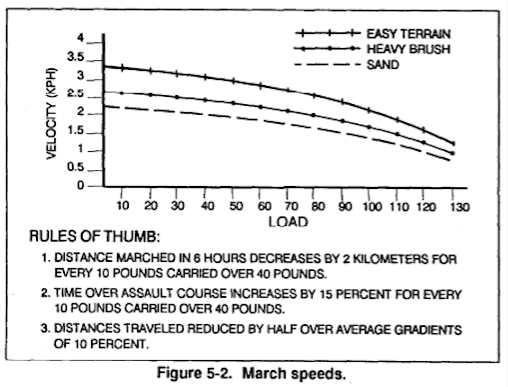
Having established that the MTI ROT is a slight underestimate of the effect of loads (especially over 40% BW) we next wanted to see how our results compared to the US Army Field Manual for Marching, FM 21-18. Below, in FIGURE 1 you can see how the US Army handles planning for movements under loads between 10# and 130#. Based on the FM, we also derived the following equation in order to compare the FM’s prediction for movement over “easy terrain” to our results:
EQUATION 1: FM 21-18, Marching Speeds Under Load
![]()
FIGURE 1: FM 21-18, Marching Speeds Under Load (Figure 5-2)

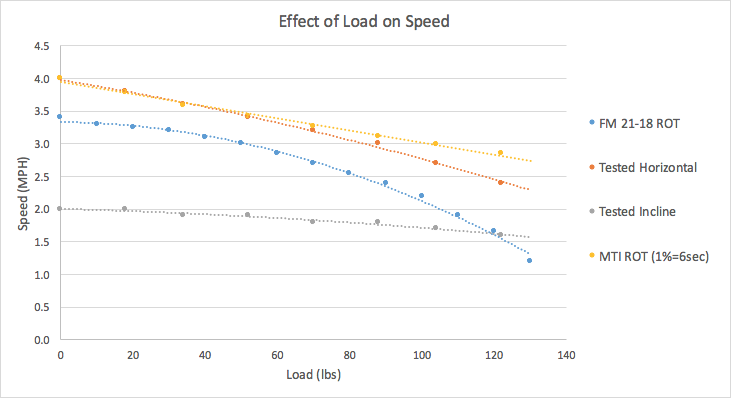
By overlaying our results with the FM 21-18 ROT we can see how, according to our data, the FM seems to over-estimate the effect of load. Below, in GRAPH 2 you can see how the FM 21-18 ROT, MTI ROT, and MTI test results compare.
GRAPH 2: Rules of Thumb and Test Results

As can be seen in the graph above, FM 21-18 (blue line) predicts a very drastic decline in speed due to load. This drastic decline is not supported by our test results (yellow and grey lines).
CONCLUSIONS
Our study revealed the following information on the relationship between load and speed:
– First, our data supports the previous research which recommends that loads be kept under 40% BW (1,3,4). The results from our study showed that loads over 40% BW result in a drastic and disproportionate decrease in speed.
– Second, although load does have a significant effect on speed, it does not appear to be as drastic as the effect shown in US Army FM 21-18.
– Third, the slower the initial speed (unloaded), the less of an impact load has on movement. This was clearly illustrated when comparing our horizontal trials (4mph) and our inclined trials (2.1mph). Based on the previous research we reviewed, this is likely the result of the prolonged ground-reaction time used at slower speeds (5-8).
– Lastly, we were able to develop the below equation to predict speed under loads.
EQUATION 2: MTI loaded speed equation:
 As an example, the equation predicts that an 175# individual who walks at 3.2mph on a 10% grade unloaded (approximately 4.5mph over flat ground) will be slowed to approximately 3.1mph with a 45# pack. If the load is doubled to 90# their speed will drop to around 2.8-2.9mph.
References:
- United States Marine Corps, Marine Corps Combat Development Command. Marine Corps Reference Publication 3-02A. Quantico, VA, JUNE 2004. http://www.trngcmd.marines.mil/Units/Northeast/TheBasicSchool/Academics/MarineForceReferencePublicationsMarineCorps.aspx. Accessed: 15 FEB, 2016.
- Headquarters Department of the Army. U.S. Army Field Manual 21-18. Washington, DC, 01 JUNE 1990. http://armypubs.army.mil/doctrine/DR_pubs/dr_a/pdf/fm21_18.pdf. Accessed: NOV 18, 2015.
- Deuster, P. The Navy SEAL Physical Fitness Guide. Department of Military and Emergency Medicine. Uniformed Services University of Health Science. Accessed: http://hprc-online.org/performance-optimization/physical-fitness/NavySEALFitnessGuide.pdf. 1997.
- Inacio, M; Dipietro, L; Videk, A and Miller, T. Influence of upper-body external loading on anaerobic exercise performance. J Str Cond Res; 25(4): 896-902. 2011.
- Watson, J; Payne, R; Chamberlain, A; Jones, R and Sellers, W. The energetic cost of load-carrying and the evolution of bipedalism. J of Human Evolution; 54: 675-683. 2008.
- Beekly, M; Alt, J; Buckley, C; Duffey, M and Crowder, T. Effects of heavy load carriage during consent-speed, simulated, road marching. Mil Med; 172(6): 592-595. 2007.
- Epstein, Y; Stroschein, L and Pandolf, K. Predicting metabolic cost of running with and without backpack loads. Eur J Appl Physiol; 56: 495-500. 1987.
- Gottschall, J and Kram, R. Ground reaction forces during downhill and uphill running. Locomotion Laboratory. University of Colorado, Boulder.
You Might Also Like 5 Run/Ruck Training Thumb Rules You Can Use
