 Adam Scott, MS, CSCS
Four weeks ago we strapped one of our new Zephyr Bioharnesses on professional Freeskier, Forrest Jillson, during a day of Freeskiing and Jackson Hole Mountain Resort (JHMR).
Amazed at what we found, we decided to do it agin…but this time we had Forrest split his time between in-bounds runs and side-country runs. Let’s see how the two ski-types compare…
Time, Runs and Calories:
During his day of in-bounds resort skiing Forrest completed 24 ski runs in just over 6 hours. He burned roughly 484 calories (kcal) per hour. Last week Forrest’s day was a little shorter at 4 hours and 45 minutes, and consisted of only 15 runs. However, at 583 calories per hour, Forrest’s second day (half in-bounds, half side-country) was definitely more metabolically demanding.
MAP 1 displays all 15 of Forrest’s runs on day 2 – Eight were considered “side-country” runs in the JHMR Casper Bowl. The remaining 7 were “in-bounds” in the Laramie Bowl.
MAP 1: Geodata from Day 2
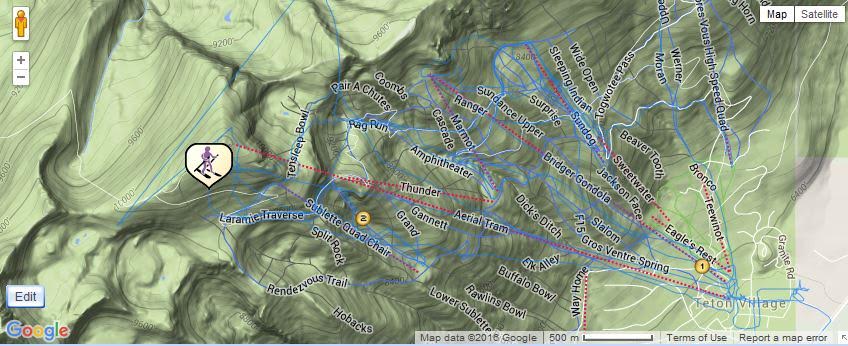
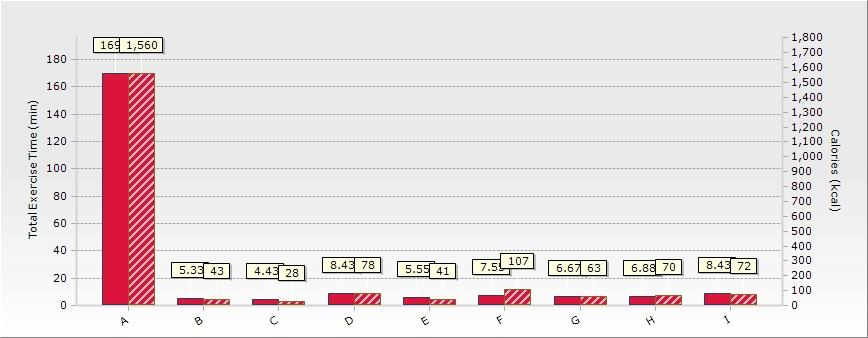
FIGURE 1 shows all eight of Forrest’s side-country runs. These runs ranged from 4.4 to 8.4 minutes. During his most intense run, Forrest burned just over 100 calories in 7.5 minutes. This run was also where Forrest reached his highest heart rate (HR) – 184 beats per minute (BPM) or 113% of VO2max. This was slightly higher than his highest HR during his in-bound rounds – 181 BPM or 111% of VO2max.
FIGURE 1: Side-Country Runs by Calories and Time
Mechanical Load:
Unlike his first day, Forest’s second day was captured using a GPS unit linked on his bioharness. This allowed us to add speed, elevation and distance to his analysis.
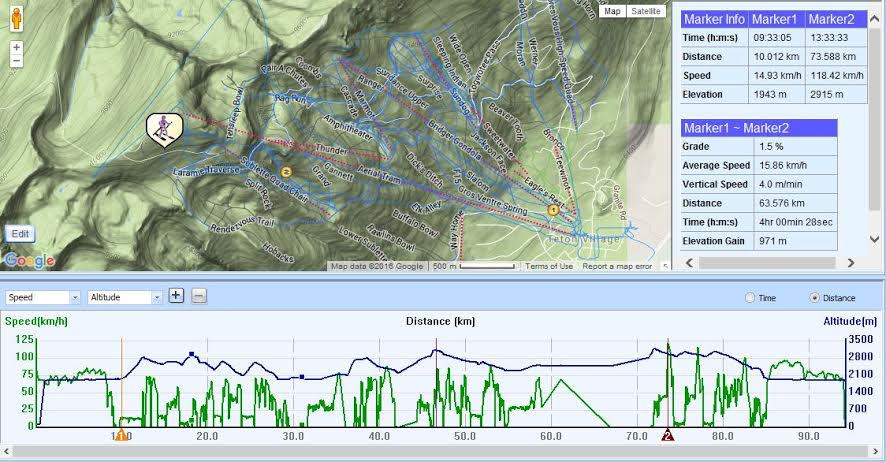
In his 4 hours and 45 minutes of skiing during day two, Forrest covered 84.5 km (52.5 miles). Forrest also reached a peak speed of 118 kph (73.3 mph), during an in-bound run. MAP 2 shows Forrest’s ski runs along with the dashboard information containing his peak speed. Marker 1 represents the beginning of Forrest’s day (9:33am) and Marker 2 shows Forrest’s peak speed (1:33pm, 4 hours into his day).
MAP 2: Day 2 Map, Plus Dashboard for Speed and Altitude
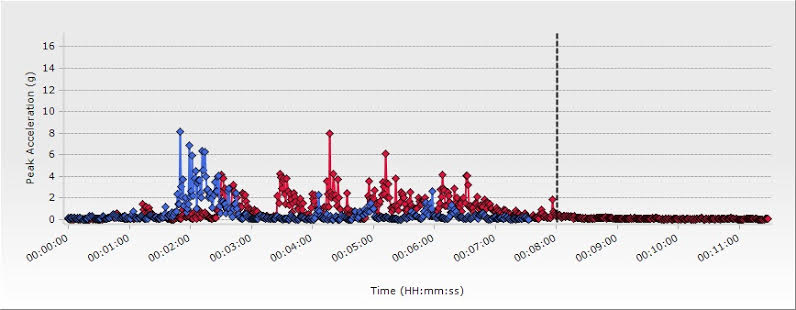
We once again used the bioharness accelerometer to measure Forrest’s tridirectional acceleration (vertical, linear and lateral). If you remember back to Forrest’s first day, we measured a g-force of approximately 8.0g – roughly 8x his normal weight (198 lbs x 8 = 1584 lbs). During his second day, Forrest managed a force of 8.6g. Both of these peaks were captured during in-bounds runs. You can see how the two runs compare in FIGURE 2
FIGURE 2: Peak Acceleration Ski Runs (Day 1 = RED, Day 2 = BLUE)
Overall Psychophysiological Load (Stress):
To compare the psychophysiological stress experienced by our athlete we looked at both his HR and his Heart Rate Variability (HRV). FIGURE 3 shows Forrest’s HR and acceleration during his 8 side-country runs during day 2. In the graph you can clearly see how increases in acceleration are correlated with increases in HR.
FIGURE 3: Day 2 HR and Acceleration during 8 side-country runs

However, HR is only part of the psychophysio-picture. Like we mentioned during the first article, HRV is a measurement of the deviation between individual heart beats (R-R cardiac signals). This number is usually reported in milliseconds (ms) and measured as the root mean square of differences of successive R-R intervals (7-10).
Typically, decreases in HRV indicate increases in stress, while increases in HRV are associated with low levels of stress (11-14).
A quick comparison of HRV data seems to show that Forrest’s side-country trips are considerably more stressful (i.e. HRV). During in-bound runs Forrest bottomed out around 22 ms and averaged around 50 ms of variability. During his 8 side-country runs Forrest reached a HRV low of 14 ms and averaged around 32 ms of variability.
Overall Comparison:
When we look at the data from the two ski-types side-by-side we get a good idea of how they stack-up. FIGURE 4 shows six major metrics assessed during our Athlete’s skiing.
FIGURE 4: Overall Comparison between In-Bounds and Side Country

Clearly, in-bounds skiing offers Forrest more opportunity for speed and acceleration (g-Force). However, his time skiing in the side-country seems far more intense. Side-country skiing was responsible for burning approximately 100 more calories per hour, a higher average HR, and significantly lower HRV (i.e. stress).
So, based on Forrest’s experience, stick to the in-bound lines if you want more speed and acceleration… but if you are willing to take the risk, side-country slopes definitely provided more opportunities for excitement.
References:
- White, G. and Wells, G. The Effect of On-Hill Active Recovery Performance Between Runs on Blood Lactate Concentration and Fatigue in Alpine Ski Racers. J Strength Cond Res 29(3): 800-806, 2015.
- Reily, T., Secher, N., Snell, P and Williams, C. Physiology of Sports. E & FN Spon, Taylor & Francis e-Library, 2005.
- Scheiber, P., Seifert, J. and Muller, E. Instructor-Paced vs. Self-Paced Skiing Modes in Older Recreational Alpine Skiers. J Strength Cond Res 25(4): 988-996, 2011.
- Neurmayr, G., Hoertnagl, H., Pfister, R., Koller, A., Eibl, G. and Raas, E. Physical and Physiological Factors Associated with Success in Professional Alpine Skiing. Int J Sports Med 24: 571-575, 2003.
- DuBois, A., Moyen, N., Pittman, M., Hamedani, B., Noffal, G., Lynn, S., Coburn, J. and Brown, L. Preliminary Field Equation to Predict Power from the Standing Long Jump. Center for Sports Performance, 2012.
- Orders of magnitude (acceleration). Wikipeida. https://en.wikipedia.org/wiki/Orders_of_magnitude_(acceleration). Accessed: 14 JAN 2015.
- The Task Force of The European Society of Cardiology and The North American Society of Pacing and Electrophysiology. Heart Rate Variability. Euro. Heart J. 17: 354-381, 1996.
- Arffa, S. The Relationship of intelligence to executive function and non-executive function measures in a sample of average above average, and gifted youth. Archives of Clin. Neuropsychology. 22: 969-978, 2007.
- Thompson, A., Swain, D., Branch, J., Spina, R. and Grieco, C. Autonomic response to tactical pistol performance measured by heart rate variability. J. Str. Cond. Res. 29(4): 926-933, 2015.
- Saus, E., Johnsen, B., Eid, J., Riisem, P., Andersen, R. and Thayer, J. The effect of brief situational awareness training in a police shooting simulator: An experimental study. Mil. Psyc. 18(Supp): 3-21, 2006.
- Pocock, Gillian (2006). Human Physiology (3rd ed.). Oxford University Press. pp. 63–64. ISBN 978-0-19-856878-0.
- Belvisi, Maria G.; David Stretton, C.; Yacoub, Magdi; Barnes, Peter J. (1992). “Nitric oxide is the endogenous neurotransmitter of bronchodilator nerves in humans”. European Journal of Pharmacology 210 (2): 221–2. doi:10.1016/0014-2999(92)90676-U. PMID 1350993.
- Costanzo, Linda S. (2007). Physiology. Hagerstwon, MD: Lippincott Williams & Wilkins. p. 37. ISBN 0-7817-7311-3.
- Essential Clinical Anatomy. K.L. Moore & A.M. Agur. Lippincott, 2 ed. 2002. Page 199.
- Song, Y. and Hakoda, Y. Executive and Non-Executive Functions in Attention Deficit Hyperactivity Disorder of the Inattentive Type (ADHD-I): A cognitive profile. J. Behavioral and Brain Sci. 4: 1-10, 2014.
- Morgan, C., Aikins, D., Stefan, G., Coric, V. and Southwick, S. Relationship between cardiac vagal tone and performance in male military personnel exposed to high stress: Three prospective studies. Psychophysiology. 44: 120-127, 2007.
- Kelly, A., Athy, J., King, M., Erickson, B., Chiaramonte, J., Vasbinder, M. and Thompson, A. Think before you shoot: The relationship between cognition and marksmanship. United States Army Aeromedical Research Laboratory – Warfighter Health Division. USAARL Report No. 2011-23. 2011.
- Taylor, M., Gould, D., Adams, B., Porrerat, E., Ward, M., Padilla, G., Evans, K. and Markham, A. Age-matched comparison of elite and non-elite military performers during free living and intense operational stress. Operational Stress and Resilience Program, Naval Aerospace Medical Research Laboratory. 2009.
- Rosenbrock, K. How many calories does running a marathon burn? Published: 29 OCT 2014. http://www.theactivetimes.com/how-many-calories-does-running-marathon-burn. Accessed: 14 JAN 2016.
- Associated Press. French skier sets speed record of 100 mph in downhill. Published: January 19, 2013. http://www.usatoday.com/story/sports/olympics/2013/01/19/french-skier-set-speed-record-world-cup-downhill/1847231/. Accessed: 03 FEB 2016.