By Adam Scott, MS, CSCS
After teaching a few of our Advanced Programming Courses over the past few months I know better than to enter into a debate for one type of pull-up over another.
So, in no way is this an argument for or against any exercise. This mini-study is simply a quantified look at common upper-body pulling movements. The reader can decide for him/herself which best fits their training goals…
METHODS
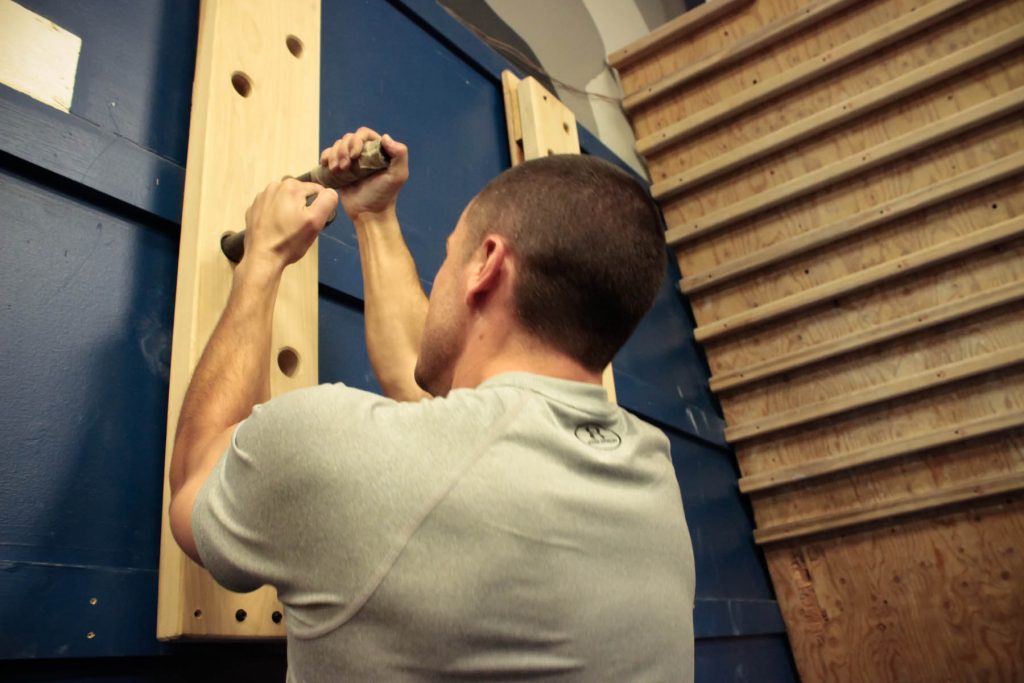
Armed with the *Athos **EMG (Electromyography) clothing we decided to test the muscle activation and heart rate (HR) response during seven common pull-up-type exercises.
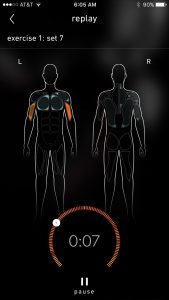
Each exercise was tested for muscle stimulation in the lats, biceps, pecs, traps, triceps, and delts. Since we weren’t concerned with bi-lateral differences, left- and right-side measures were averaged to create a single score for each muscle group.
The testing protocol consisted of five rounds, each round contained all seven exercises:
5 Rounds, 60-90 seconds rest between exercises
- 5x Pull-Ups
- 5x Chin-Ups
- 5x Kipping Pull-Ups
- 3x Bar Muscle-Ups
- 5x Tarzan Pull-Ups (Mixed Grip)
- 20ft Legless Rope Climb
- Peg Board Ascent (10x Holes)
Here is what we found…
RESULTS & DISCUSSION
Not surprisingly there was very little difference in HRs between the exercises. After all, these were short sets with ample recovery time. Each training set lasted between 11 and 19 seconds. With the kipping pull-ups being the shortest (average = 12.5 sec) and the rope climb being the longest (average = 17.0 sec). TABLE 1 contains the average HR and standard deviation for each exercise.
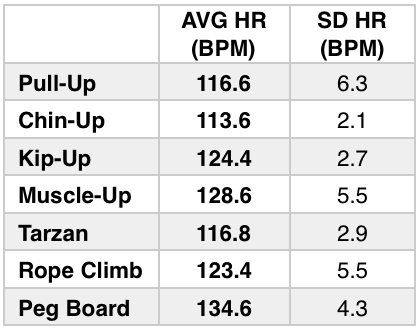
As you can see that Peg Board climb actually produced the highest average HR, followed by Muscle-Ups (3 reps). The lower HRs were found, not surprisingly, in the Pull-Ups, Chin-Ups and Tarzan Pull-Ups. SEMG Muscle Activation:
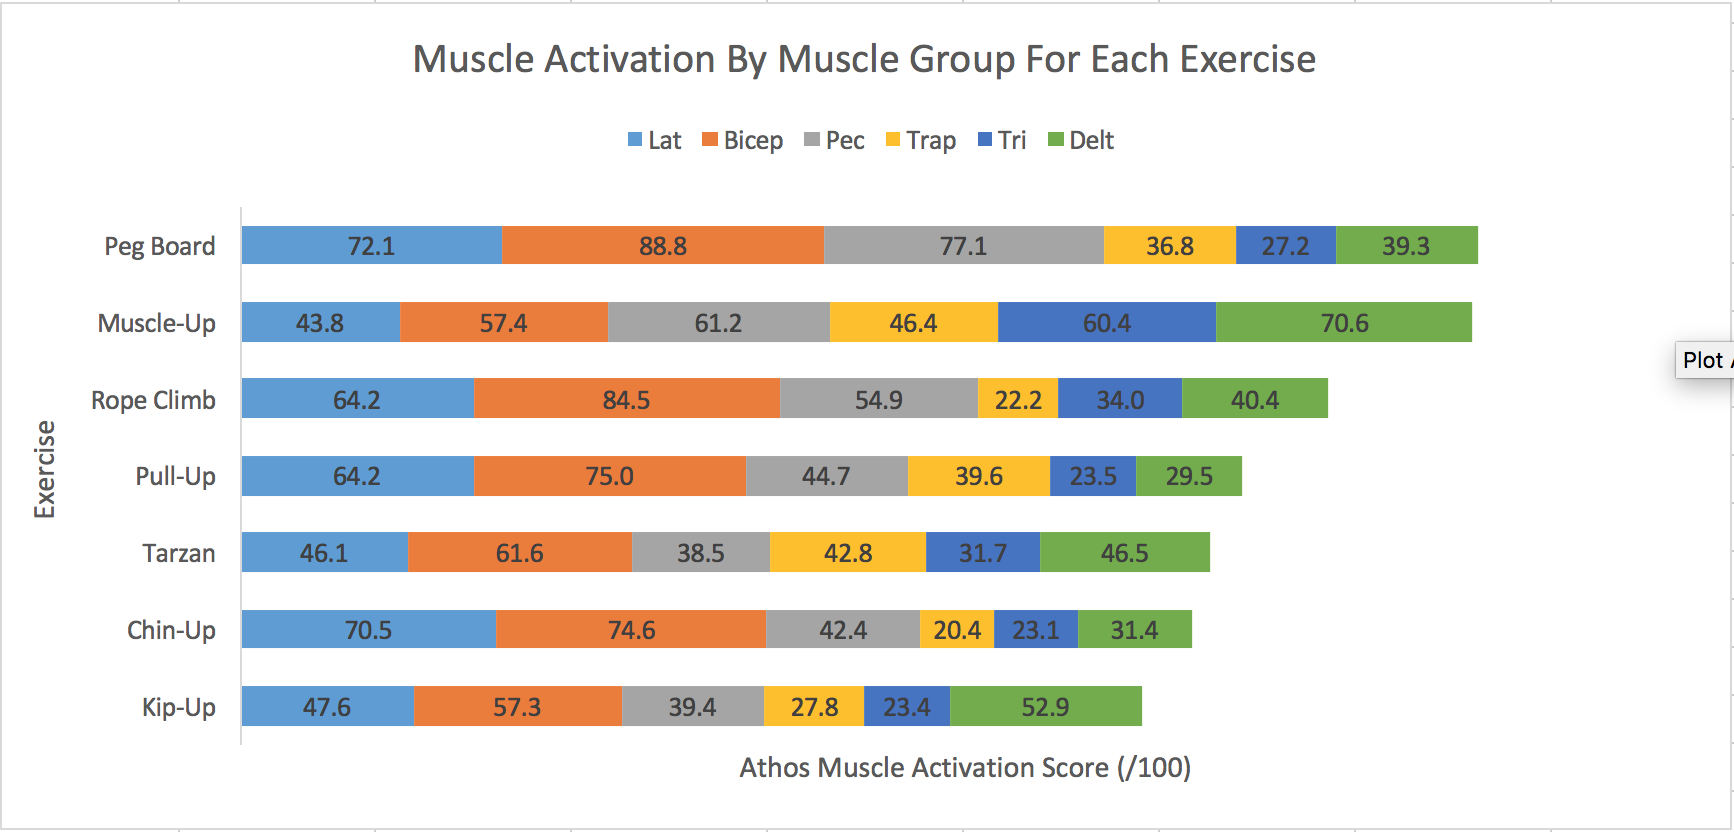
Based on our sEMG data, we found that the Peg Board ascent just barely edged-out Muscle-Ups for the most muscle activation (341.2 to 339.8 **Athos PME Score). Interestingly, although the total muscle activations were similar for the two exercises, the individual muscles they used were very different.
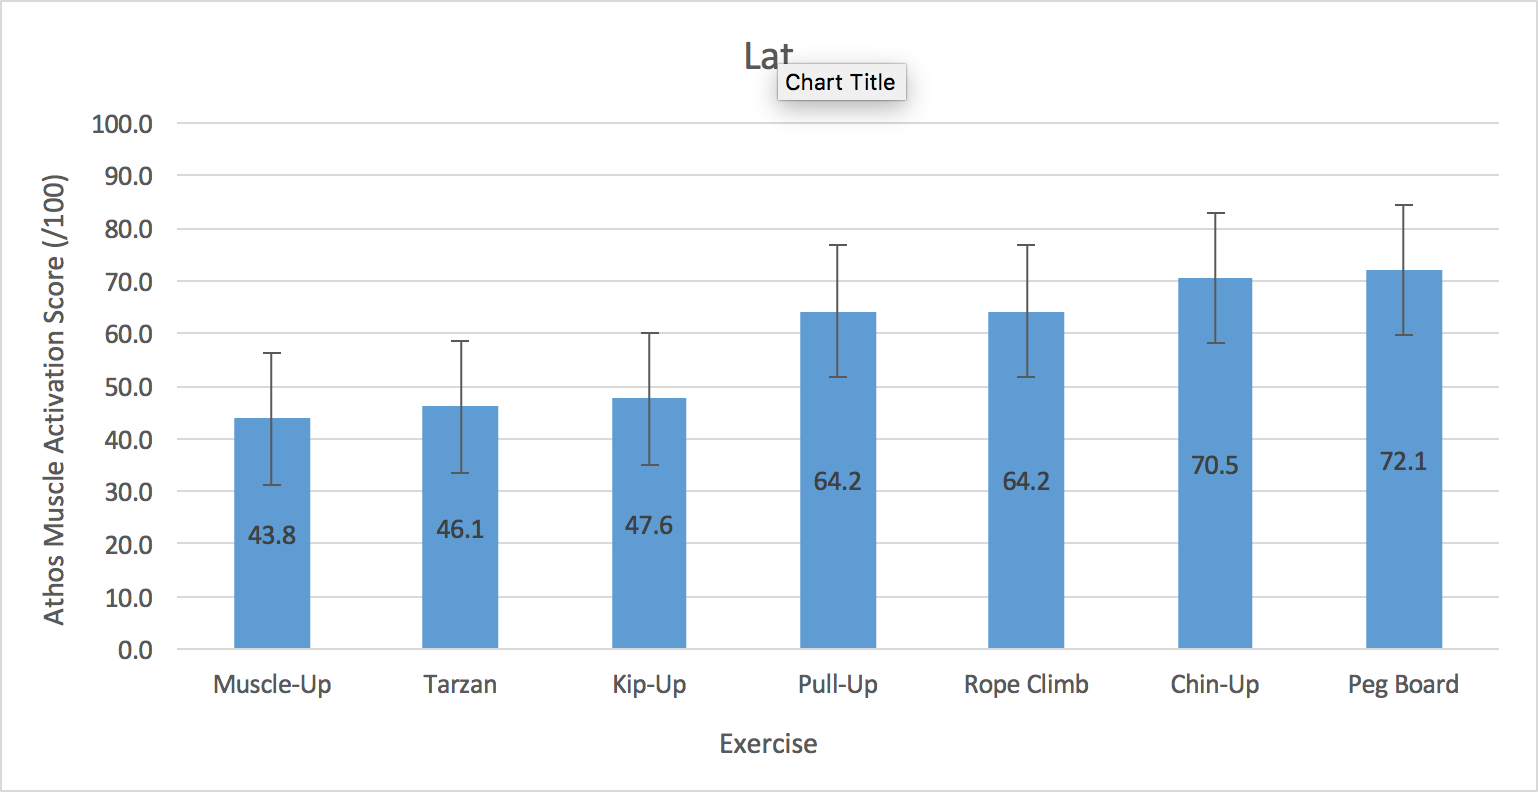
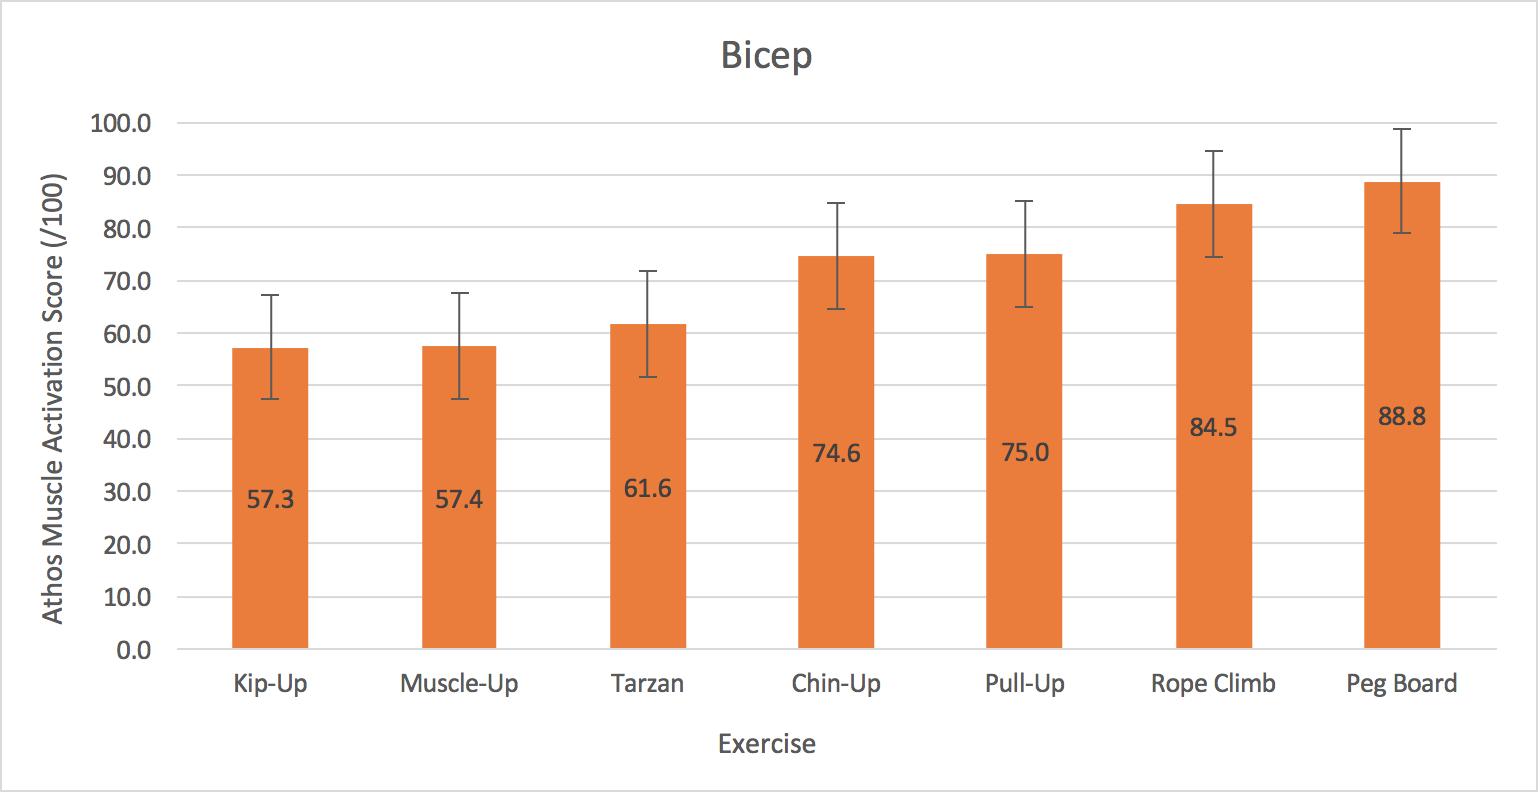
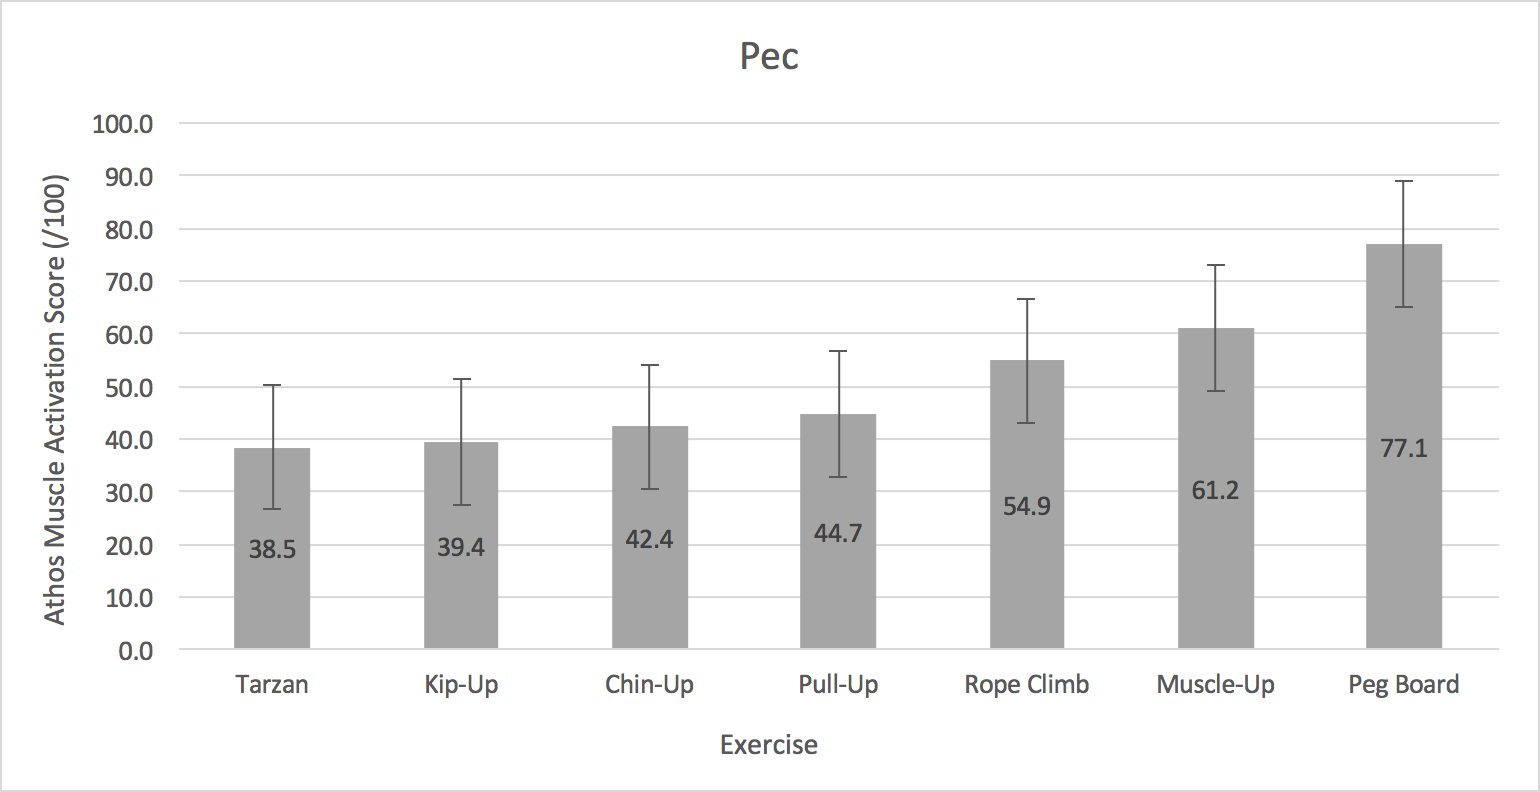
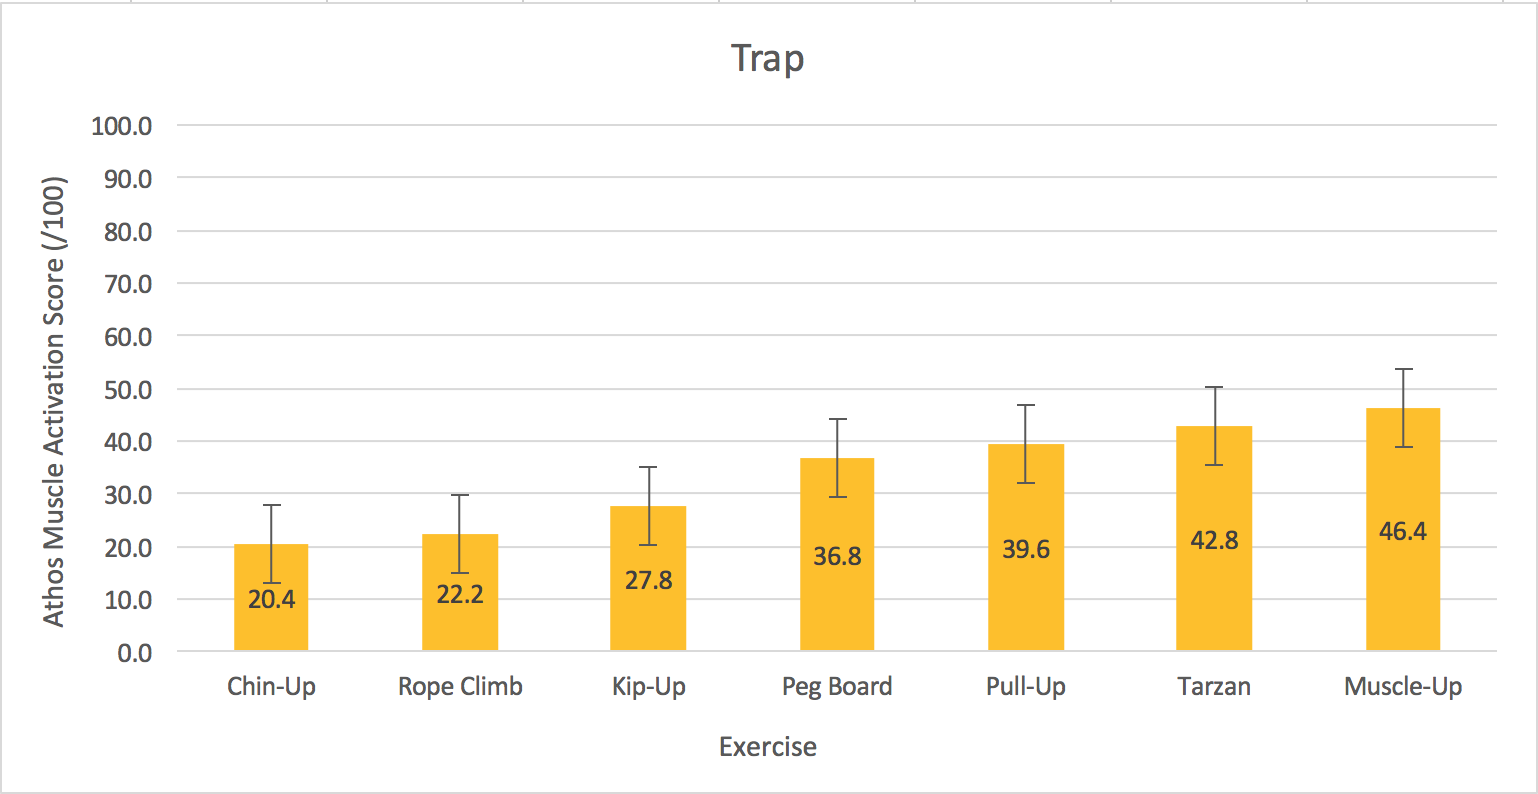
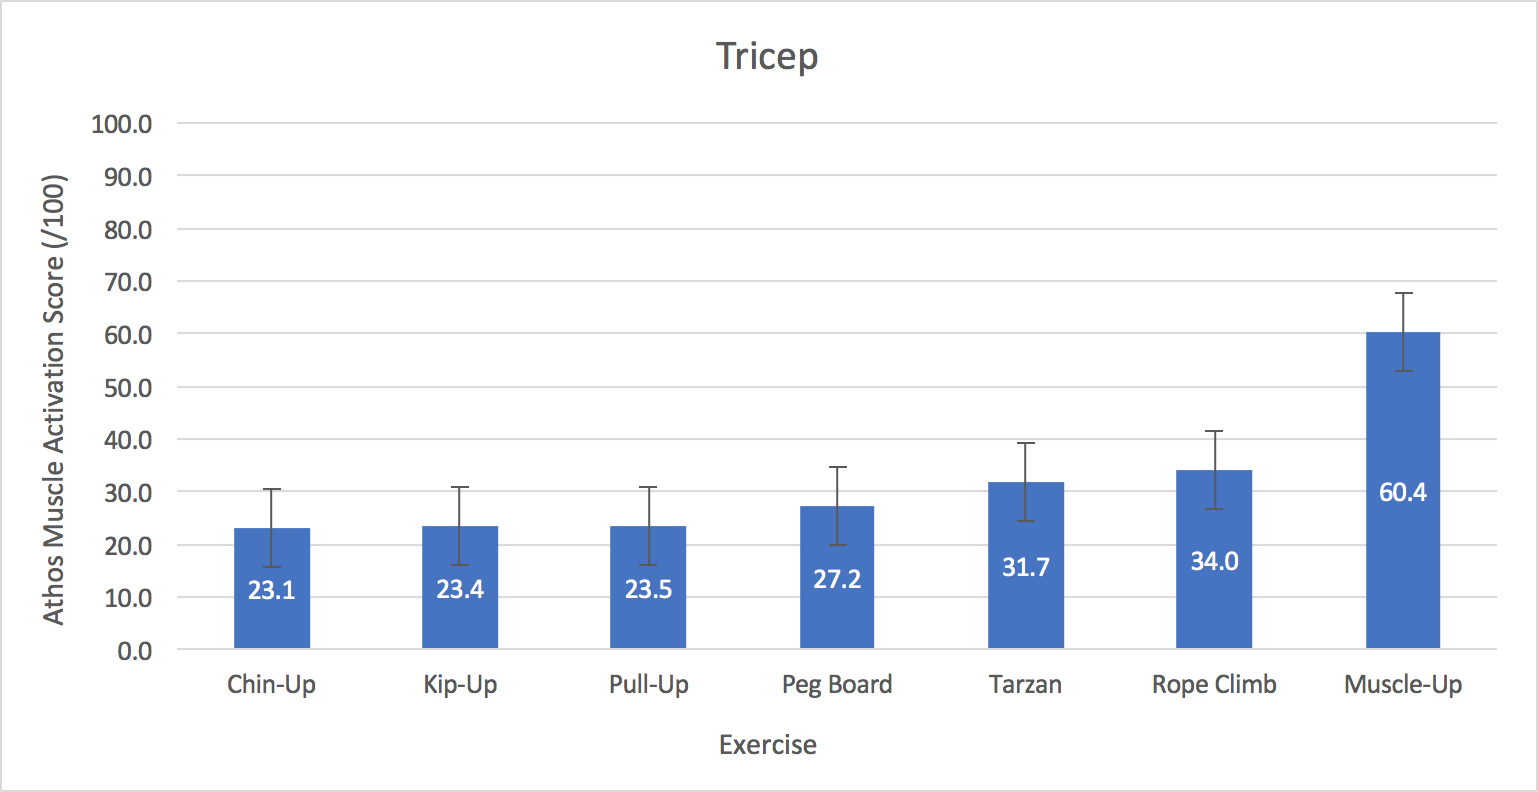
TABLE 2 and GRAPH 1 contain the average muscle activation scores for each exercise. As you can see in the table, the Peg Board ascent was heavily dominated by the lats, biceps, and pecs. While Muscle-Ups required far more traps, triceps, and delts (more on this below).
GRAPH 1: Muscle Activation

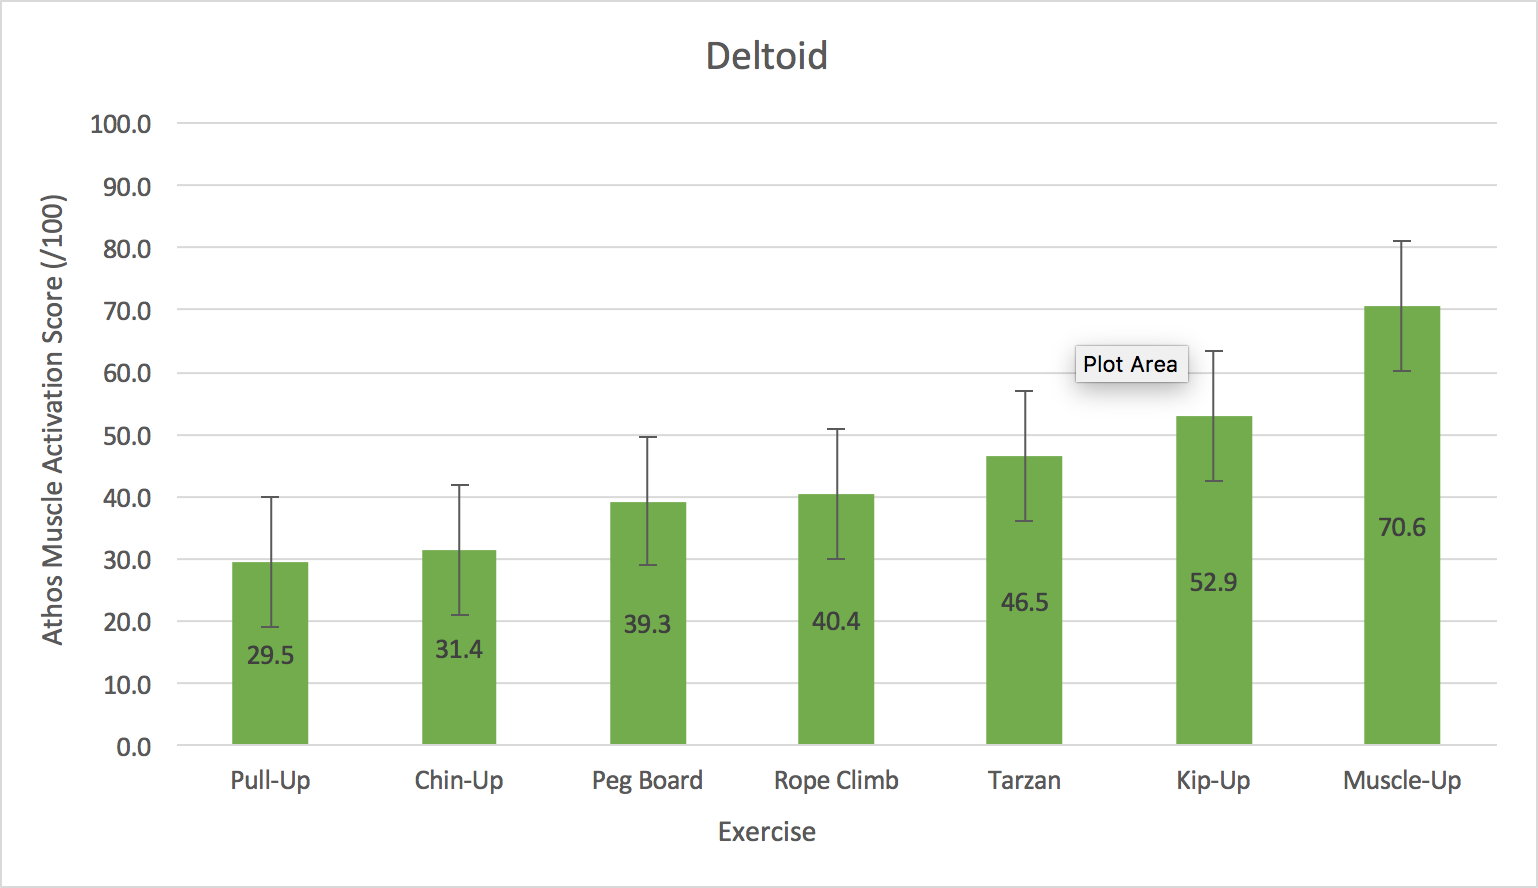
GRAPH 7: Muscle Group: Deltoids
CONCLUSION
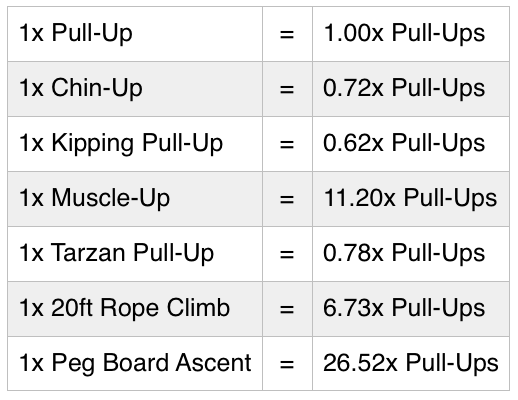
Just for fun, we attempted to calculate the difficulty of each exercise. Based on our data we can offer the following estimations for overall difficulty. These rough estimations are the result of a predictive equation derived from the athletes’ muscle activation (weighted for increased effect), their HR and a magnitude constant (based on the weighted ordinal ranking of the exercises).
TABLE 3: Pull-Up Conversions For Each Exercise***
NOTES:
*Note 1: Athos clothing uses Surface Electromyography (sEMG) via embedded electrodes to detect electrical activity generated by the muscles.
**Note 2: Athos clothing reports muscle activity in “percent muscle effort [PME] on a scale of 0 to 100% where 100% is [the] highest potential.” According to the company, a muscle effort score is based on the sEMG upper signal bound (the highest signal or output an individual’s muscle can produce).
***Note 3: Estimated Equation is:
[(((Exercise PME)-(Pull-Up PME))/Pull-Up PME)*2+((Exercise HR)-(Pull-Up HR))/(Pull-Up HR))]*[(Ordinal Rank^1.1)*(Pull-Up Reps/Exercise Reps)]
You Might Also Like MTI’S Favorite Upper Body “Pull” Exercises