Above: A short clip of Forrest Jillson from last season.
By Adam Scott, MS, CSCS
Most research examining the physiological demands of downhill skiing is well over 20 years old (1). In that time the sport, its equipment, and our research tools have changed drastically…it is time to start updating our information.
We started reexamining two-decades-old research using our local athletes. Our first step was a simple case study using professional free skier and MTI Athlete, Forrest Jillson.
For this initial study we had Forrest wear one of our new Zephyr Bioharnesses during a day of Freeskiing and Jackson Hole Mountain Resort. Before we get to the skiing, a little information about our subject:
Athlete Summary…
- Numerous Top 5 and Top 10 finishes on the Freeride World Tour (FWQ), including two wins in 2014.
- As you can see in TABLE 1, physiologically, he is nearly identical to the average elite alpine skier in age, height, weight and percent body fat (2,4).
- TABLE 1 also shows that Forrest’s aerobic capacity (VO2max) and maximum power output are virtually indistinguishable from an elite alpine skier (2,4). Basically, he is a textbook example of an “elite skier.”
TABLE 1: Case Study Athlete Data

Now on to the skiing…
One Day Totals:
Forest spent just over 6 hours (364.5 minutes) on the slopes during our study. In that time he completed 24 separate ski runs. This is roughly 2-4x as many runs as the typical alpine skier will make during a training block (1).
In his 6 hours of skiing Forrest burned approximately 2,905 calories (kcals). This equals about 484 calories per hour or 5.3 metabolic equivalent units (METs). By comparison, at the generalize rate of 100 calories per mile (19), running a marathon burns roughly 2,600 calories.
Metabolic Load:
Since we couldn’t find any data on Freeskiing we decided to compare Forrest’s data to the nearest competitor, alpine skiing. Alpine skiing, like baseball, fencing, gymnastics, and surfing, is classified as between 60-80% anaerobic (2). One study, looking at highly trained ski racers, found metabolic demands as high as 160-200% VO2max during Giant Slalom and Slalom (1).
Three weeks prior to his day on the slopes, Forest completed a standard treadmill metabolic test. This test established his previously reported VO2max (TABLE 1) as well as his aerobic threshold HR (105 BPM), his anaerobic threshold HR (155 BPM) and his peak HR (163 BPM, at VO2max).
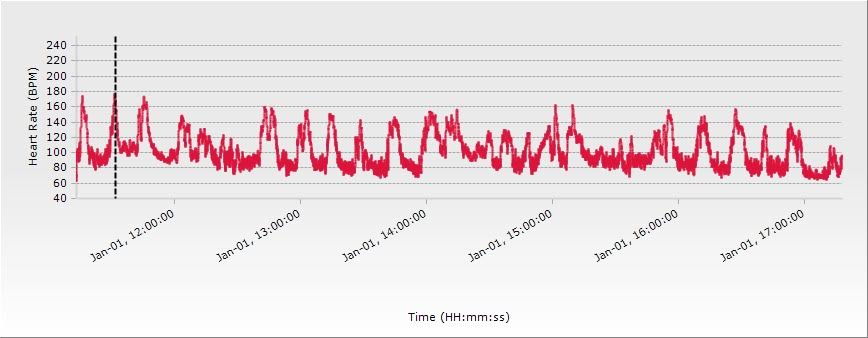
As you can see in FIGURE 1, nearly every ski run produced a HR of between 140-160 BPM, this places his runs on the high end of his anaerobic zone – 86%-98% of peak HR.
During at least 5 runs, Forrest’s HR actually exceeded his peak HR from the Treadmill test. Forrest’s maximum heart rate during the ski day occurred during his second run – 181 BPM or 111% of his VO2max peak.
FIGURE 1: Heart Rate (HR) Over Time (BPM)
Mechanical Load:
Unfortunately this first study did not collect GPS data, so we don’t have information on Forrest’s speed or distance (…next time). However, we did use the bioharness’s accelerometer to measure Forrest’s tridirectional acceleration (vertical, linear and lateral).
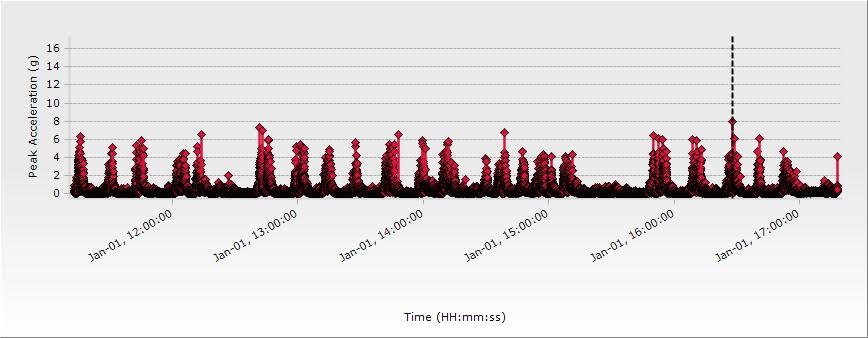
This feature allowed us to measure the acceleration forces that Forrest experienced while skiing. Not surprisingly, the greatest amount of acceleration he experienced was during jumps and, especially, during sharp turns. FIGURE 2 shows the peak acceleration Forrest experienced in “g-force” (one g is equal to approximately 9.8 m/s/s of acceleration). During most runs he reaches a g-force of around 6 g.
FIGURE 2: Peak Accelerations (g) Over Time
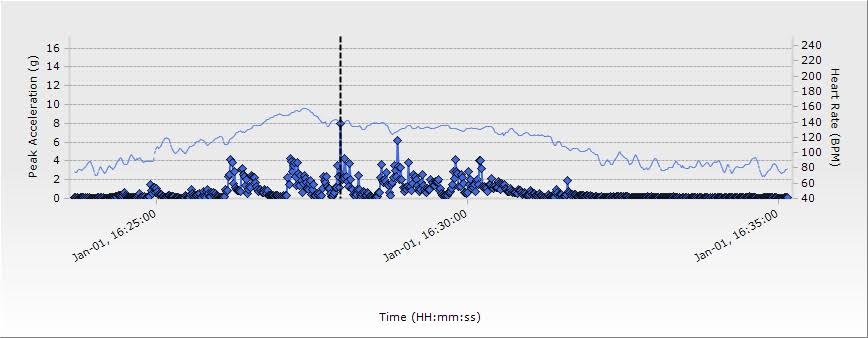
Forrest achieved an overall maximum of 8.0 g during his 21st ski run (FIGURE 3). An acceleration of 8 g means that Forrest briefly experiences a weight (force) of approximately 8x normal (198 lbs x 8 = 1584 lbs). By comparison, NSACAR drivers hit about 2-3 G’s during their turns (although this is sustained for 5-15 seconds) (6).
FIGURE 3: Peak Acceleration (g) and Heart Rate (HR) During Individual Ski Run
Psychophysiological Load (Stress):
To assess the psychophysiological load experienced by our athlete we looked at Heart Rate Variability (HRV). HRV is a measurement of the deviation between individual heart beats (R-R cardiac signals) (7). HRV has gained an increasingly robust following in stress research because it can non-invasively provide insight into nervous system activation and processing (7-10).
The complexities of peripheral nervous system (PNS) not withstanding, basically what you need to know is that decreases in HRV typically indicate increases in stress. This response is characterized by “fight or flight” decision making. In contrast, increases in HRV are associated with low levels of stress (11-14).
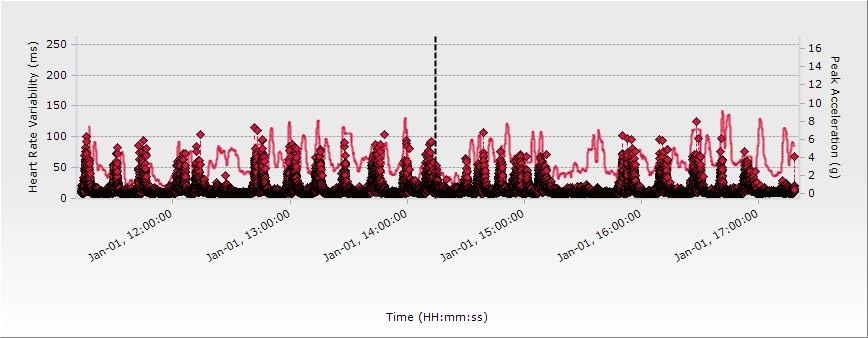
FIGURE 4 shows Forrest’s HRV over the entire 6 hour period. The dots (red and black) represent the acceleration Forrest is experiencing. The red line represents Forrest’s HRV in milliseconds (ms).
What is interesting about the “10,000-ft view” in FIGURE 4 is Forrest’s ability to switch between low stress situations and high stress situations extremely quickly. For example, when a ski run reaches higher levels of danger (i.e. higher acceleration) Forrest’s HRV drops. This allows him to narrow his focus and be reactive to the task-at-hand. Then, as the level of danger dissipates (i.e. lower acceleration) Forrest’s HRV quickly recovers. Thus, he is able to quickly resume executive functions like planning and mental flexibility. (8,15)
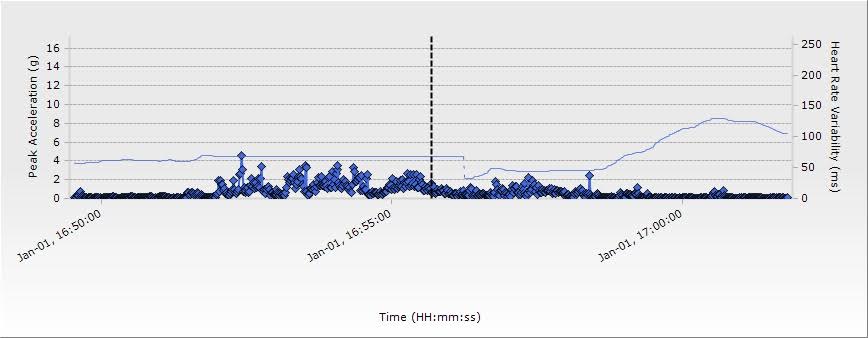
FIGURE 4: Heart Rate Variability (HRV) and Acceleration (g) Over Time
In FIGURE 5 we zoom in on a single run. Although this run is not particularly stressful (peak acceleration is only 4.4 g) you can clearly see Forrest’s relatively low HRV. Then, at the conclusion of the run his HRV climbs quickly, indicating a return to a non-stressed state.
Since we do not have a baseline HRV for Forrest, we can’t compare these variations to a “norm.” However, what we can say is that this ability to rapidly transition between a stressed response and a non-stressed response is common among trained airplane pilots and tactical professionals (10,16-18).
FIGURE 5: Heart Rate Variability (HRV) and Acceleration (g) During a Single, Moderately Challenging Ski Run
What’s Next?
This pilot study just managed to scratch the surface of the physical and physiological demands faced by a modern downhill skier. Further studies should allow us to look far beyond the previously reported physical demands and provide new insights into the growing sport of freeskiing.
As we move into the next phase of this research we plan to tap into our bioharnesses’ accelerometers and GPS tracking functions. This data will allow us to dive-deeper into g-forces, speeds and the athlete’s physiological responses.
Another aspect which is particularly intriguing is the ability to compare the psychophysiological stress of our mountain athletes and tactical athletes. Based on what we saw with Forrest’s HRV it appears that an individual’s ability to regulate nervous system response (PNS) may have some very intriguing carryover between the two populations. This is definitely an area we would like to explore more.
References:
- White, G. and Wells, G. The Effect of On-Hill Active Recovery Performance Between Runs on Blood Lactate Concentration and Fatigue in Alpine Ski Racers. J Strength Cond Res 29(3): 800-806, 2015.
- Reily, T., Secher, N., Snell, P and Williams, C. Physiology of Sports. E & FN Spon, Taylor & Francis e-Library, 2005.
- Scheiber, P., Seifert, J. and Muller, E. Instructor-Paced vs. Self-Paced Skiing Modes in Older Recreational Alpine Skiers. J Strength Cond Res 25(4): 988-996, 2011.
- Neurmayr, G., Hoertnagl, H., Pfister, R., Koller, A., Eibl, G. and Raas, E. Physical and Physiological Factors Associated with Success in Professional Alpine Skiing. Int J Sports Med 24: 571-575, 2003.
- DuBois, A., Moyen, N., Pittman, M., Hamedani, B., Noffal, G., Lynn, S., Coburn, J. and Brown, L. Preliminary Field Equation to Predict Power from the Standing Long Jump. Center for Sports Performance, 2012.
- Orders of magnitude (acceleration). Wikipeida. https://en.wikipedia.org/wiki/Orders_of_magnitude_(acceleration). Accessed: 14 JAN 2015.
- The Task Force of The European Society of Cardiology and The North American Society of Pacing and Electrophysiology. Heart Rate Variability. Euro. Heart J. 17: 354-381, 1996.
- Arffa, S. The Relationship of intelligence to executive function and non-executive function measures in a sample of average above average, and gifted youth. Archives of Clin. Neuropsychology. 22: 969-978, 2007.
- Thompson, A., Swain, D., Branch, J., Spina, R. and Grieco, C. Autonomic response to tactical pistol performance measured by heart rate variability. J. Str. Cond. Res. 29(4): 926-933, 2015.
- Saus, E., Johnsen, B., Eid, J., Riisem, P., Andersen, R. and Thayer, J. The effect of brief situational awareness training in a police shooting simulator: An experimental study. Mil. Psyc. 18(Supp): 3-21, 2006.
- Pocock, Gillian (2006). Human Physiology (3rd ed.). Oxford University Press. pp. 63–64. ISBN 978-0-19-856878-0.
- Belvisi, Maria G.; David Stretton, C.; Yacoub, Magdi; Barnes, Peter J. (1992). “Nitric oxide is the endogenous neurotransmitter of bronchodilator nerves in humans”. European Journal of Pharmacology 210 (2): 221–2. doi:10.1016/0014-2999(92)90676-U. PMID 1350993.
- Costanzo, Linda S. (2007). Physiology. Hagerstwon, MD: Lippincott Williams & Wilkins. p. 37. ISBN 0-7817-7311-3.
- Essential Clinical Anatomy. K.L. Moore & A.M. Agur. Lippincott, 2 ed. 2002. Page 199.
- Song, Y. and Hakoda, Y. Executive and Non-Executive Functions in Attention Deficit Hyperactivity Disorder of the Inattentive Type (ADHD-I): A cognitive profile. J. Behavioral and Brain Sci. 4: 1-10, 2014.
- Morgan, C., Aikins, D., Stefan, G., Coric, V. and Southwick, S. Relationship between cardiac vagal tone and performance in male military personnel exposed to high stress: Three prospective studies. Psychophysiology. 44: 120-127, 2007.
- Kelly, A., Athy, J., King, M., Erickson, B., Chiaramonte, J., Vasbinder, M. and Thompson, A. Think before you shoot: The relationship between cognition and marksmanship. United States Army Aeromedical Research Laboratory – Warfighter Health Division. USAARL Report No. 2011-23. 2011.
- Taylor, M., Gould, D., Adams, B., Porrerat, E., Ward, M., Padilla, G., Evans, K. and Markham, A. Age-matched comparison of elite and non-elite military performers during free living and intense operational stress. Operational Stress and Resilience Program, Naval Aerospace Medical Research Laboratory. 2009.
- Rosenbrock, K. How many calories does running a marathon burn? Published: 29 OCT 2014. http://www.theactivetimes.com/how-many-calories-does-running-marathon-burn. Accessed: 14 JAN 2016.