By Rob Shaul, Founder
The MTI Lab Rats began another of our “geek” cycles a couple weeks ago. We used these cycles to study and test programming. This cycle is researching four areas.
(1) Strength: Testing Working Strength Programming Progression
MTI’s Working Strength Progression is our latest and newest strength progression and this cycle we’re testing a set rep scheme using barbells.
The set/rep scheme is based on our existing Density Strength progression – which deploys an interval clock, and percentage-based progression based on a 1RM. Density Strength has been a proven strength builder for us over the years. Another great feature of this programming is its efficiency.
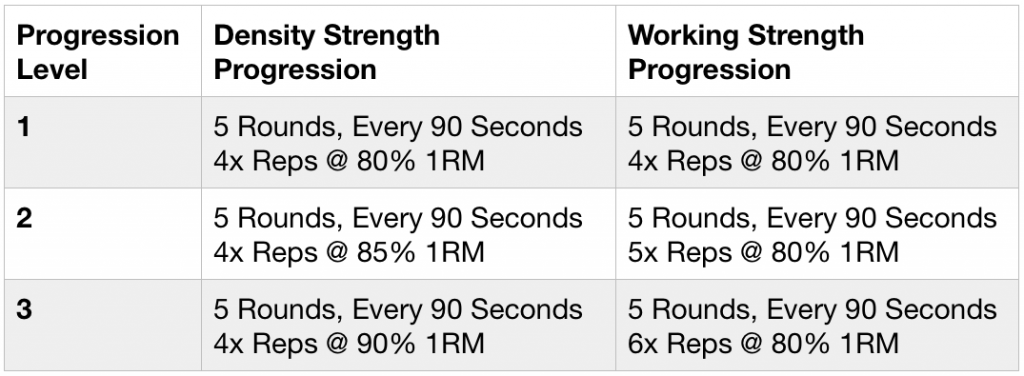
With Density Strength, we complete a 1RM (1 Repetition Maximum) and then begin the progression with 5 Rounds of 4 reps at 80% 1RM, every 90 seconds.
We generally complete each progression level twice, then keep the reps per round the same, but increase the load by 5% – so the second progression would be 5 Rounds of 4 reps at 85% 1RM, every 90 seconds, then 90%, etc.
For this test on Working Strength, we’ve kept the 1RM test, 5 Rounds and 90-second interval but manipulated the load (% of 1RM) and the reps. Specifically, instead of keeping the reps the same as we move up progression levels and progressing the loading, we’ve kept the loading the same, and increased the reps. See below:

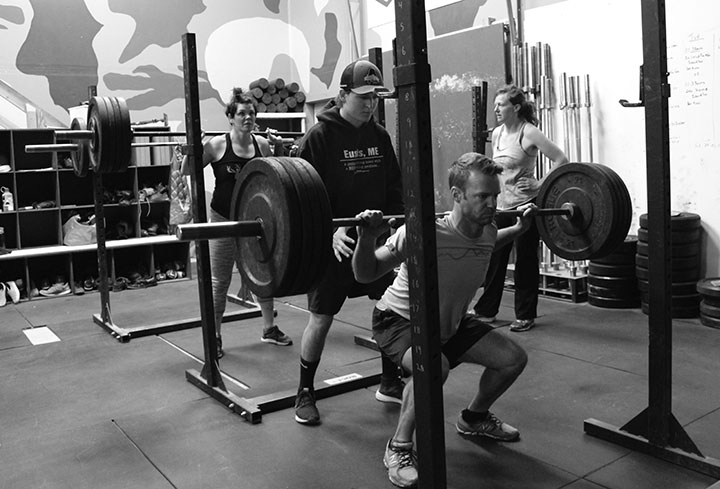
Two exercises are being deployed for this test – back squat and bench press.
We’re looking at two elements here – First, whether or not the Lab Rats can keep up with this progression schedule – each level will be trained twice.
Second, do they increase max effort strength?
We’ll re-test 1RM mid-way through and at the end to see if this progression leads to mass effort strength gains, and if so, how these compare to our other strength progressions, where for trained athletes, we’ll regularly see a 10-20% increase across a 5-6 week cycle.

(2) Work Capacity – How Does Power Compare Across 3 Events?
For years we’ve experimented with using power to program and progress work capacity. Under MTI programming, work capacity events are intense, sometimes multi-modal and last 30 minutes or less.
A couple years ago we spent some time trying to develop a tactical athlete work capacity standard. For more read Part 1, Part 2 and Part 3.
Simply put, “Power” is the rate of doing work – typically measured in Watts (w).
Power (P) = Work (w) / Time (t) , and…
Work (w) = Force (f) x Displacement (d), and…
Force (f) = Acceleration (a) x Mass (m), and…
Acceleration (a) = △Velocity (△v) / Time (t), and…
Velocity (v) = Displacement (d) / Time (t)…
…Thus…
Power (P) = Mass (m) x Displacement2 (d2) / Time3 (t3)
There are three ways to increase Power.
(1) Move heavier stuff (increase mass)
(2) Move stuff further (increase displacement)
(3) Move stuff faster (decrease time)
Improving any one of these factors (while the other two, at least, stay the same) will have a positive effect on power. Changes in time typically have the greatest impact on power output (time is cubed), followed by displacement (displacement is squared), followed by mass.
At the meso-level, or cycle level, we currently program work capacity events based on duration – 5, 10, 15, and 20-30 minute events. Often, we’ll deploy the same event multiple times through the cycle, and progress the event.
For example, a multi-modal, 5-minute event for men could be 5 Rounds, every minute on the minute (EMOM) of 5x Power Clean @ 115# + 5x Box Jumps @ 24″ + 5 Burpees.
A simple, in-cycle progression for this event would progress this to 6x reps of every exercise, then 7x, etc., while keeping the interval (EMOM) the same.
We can do better – and perhaps the answer lies in using power to program and progress work capacity events.
For example, instead of using different durations, we could program different power outputs … for example, 100 watts, 200 watts and 300 watts.
We could similarly use power to progress the same event.
Power-based progression is used to great effect for cycling and rowing – where bikes and ergs have handy power meters to do the math for the athlete. It’s more complicated for gym-based events, where individual athlete height and weight matter and must be part of the equation.
For this cycle, we’re simply interested in how individual athlete power output compares across 3 individual events. To make things simple, we’ve kept the duration the same – 3 minutes. We’re testing max reps in 3 minutes for (1) Box Jumps @ 24″; (2) Power Clean + Push Press @ 65/95#, and; (3) Sandbag Getups @ 40/60#.
We’re simply interested to see if the same athlete demonstrates similar power levels across all three events, and how difficult it is for us to calculate this power output.

(3) Endurance – Does Work in One Mode Transfer to Improvement to Another Mode
Does swimming make you a better runner? Does running make you a better cyclist? Does cycling make you better at hiking uphill? These are common questions.
More generally, does work in one endurance mode transfer to improvement in another endurance mode. If so, how much?
For this mini-study we’re testing unloaded step ups and unloaded running.
Week 1 of the cycle, all the lab rats completed a 3-mile run for time and 800x step ups for time. Then I split the lab rats into two groups – running and step ups.
The running group completes hard 1-mile intervals on Tuesdays, and a moderate-paced 4-mile run on Thursdays.
The step up group completes hard 266x (1/3 of 800) step up intervals on Tuesdays and moderate-paced 1,000 step ups on Thursdays.
Mid-cycle and the last week, the lab rates will re-test both 3-mile run and 800x step up times. We’re interested to see how running group’s improvement in step up performance compared to it’s running improvement. We expect their running improvement to be greater.
Likewise, we’re curious how the step up groups improvement in step ups compares to its improvement in running. We expect their step up improvement to be greater than their running improvement.
For both groups, we’re really interested in how much improvement, if any, they see in the other mode.

(4) Climbing – Testing Hang Board Intervals
During this Spring’s Rock Climbing Pre-Season Training Cycle we deployed 20:40 hang board intervals (20 seconds work, 40 seconds rest) but did not see the level of strength improvement post-cycle I’d hoped for.
Post-cycle I did some research and was unable to find research that searched for the best hang board training work. Other coaches deploy work intervals ranging from 3 to 15 seconds, with varying rest intervals.
I did find a study analyzing movement patterns and work at elite bouldering competitions. The researches found that the average time per hand hold over the course of the competition was 8 seconds and it appears this durations is what many hang board interval protocols are based on.
So this cycle we’re comparing two separate work/rest intervals, each with a 1:3 work to rest ratio: (1) 4:12, (2) 8:24.
The “test” is a dead hang for time on the rung of our hardest campus board – an edge with approximately 1 inch.
All the lab rats completed the dead hang for time on this ledge, then were split into two groups, 4:12 and 8:24.
Here’s the protocol:
3 Sets ….
8 Rounds
4 seconds hang, 8 seconds rest or 8 seconds hang, 16 seconds rest
Rest 2 minutes between 8 Round efforts.
The dead hangs are being completed, as much as possible, on the same ledge as the assessment. When athletes fail, they are moved to a bigger ledge. Likewise, if athletes are able to make it through all their prescribed dead hang sets on the assessment ledge unloaded, weight is added in for the form of a backpack in 10 pound jumps. If they are able to make all 3 sets with a 10 pound backpack, the load is increased to 20 pounds, etc.
My hope is by keeping the work to rest ratio the same for both protocols (1:3), we’ll be able to determine which work duration, 4 seconds or 8 seconds, is best for improving dead hang strength.
Both groups of lab rats will re-take the assessment mid-cycle and at the end of the cycle.
Questions, Comments, Feedback? Email coach@mtntactical.com