Adam Scott, MS, CSCS
In a previous Mini-Study, we looked at how to calculate power output in multimodal work capacity events. We also examined where these calculations can offer valuable insight and where they are lacking (Part I).
With this Mini-Study, we wanted to take it a step further and compare elite power outputs in cycling, rowing, and CrossFit. Hopefully finding commonalities will allow us to get another step closer to developing a work capacity standard for operators.
Step 1: Selecting Events
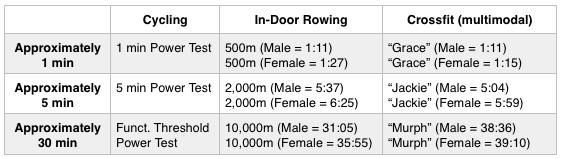
Since maximum power output is inversely related to time, the first thing we needed to do was match events of similar duration.
It wasn’t perfect, but we got pretty close using the associations below. For cycling we selected maximum power output measures from World Class athletes during 1-minute, 5-minute, and Functional Threshold Power tests. For in-door rowing we used 500m, 2,000m and 10,000m world records. And for CrossFit, we used “Grace”, “Jackie” and “Murph” WODs. “Grace” and “Jackie” times were the fastest times reported via Crossfit online forums. For “Murph” we used the winning times from the 2015 Crossfit Games (weight vest included).
Step 2: Comparing Power
With our events identified we were then able to compare power outputs. First we examined absolute power output and next we looked at power-to-weight ratios.
Absolute Power Data
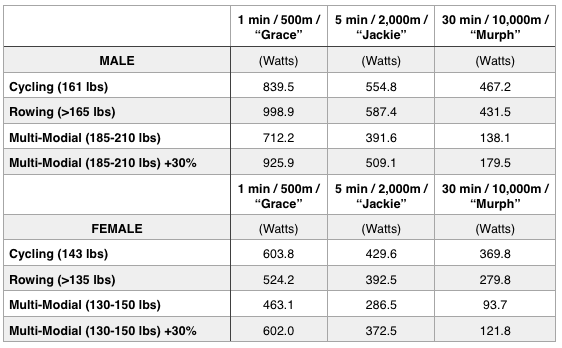
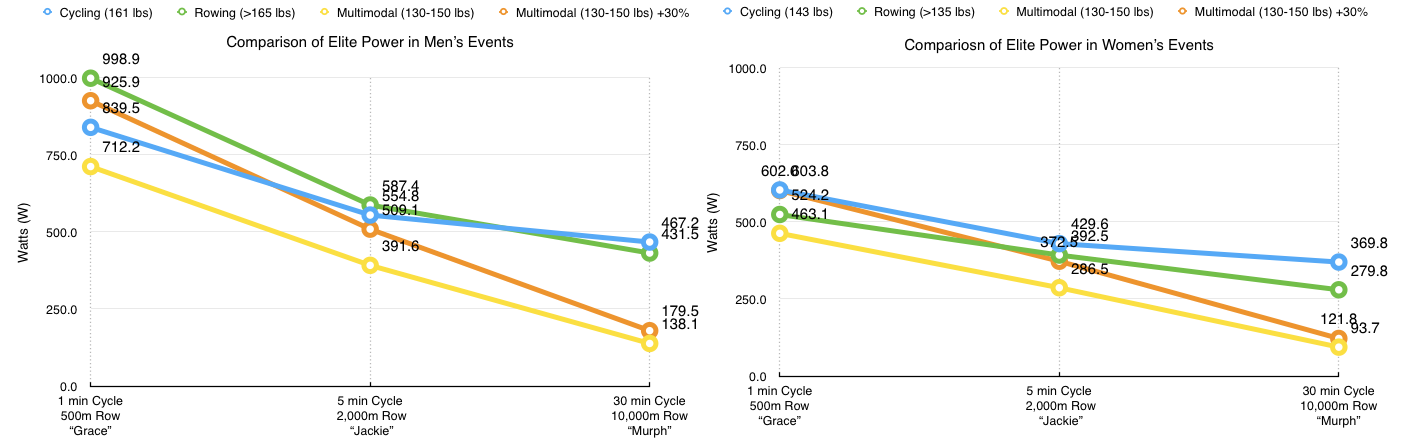
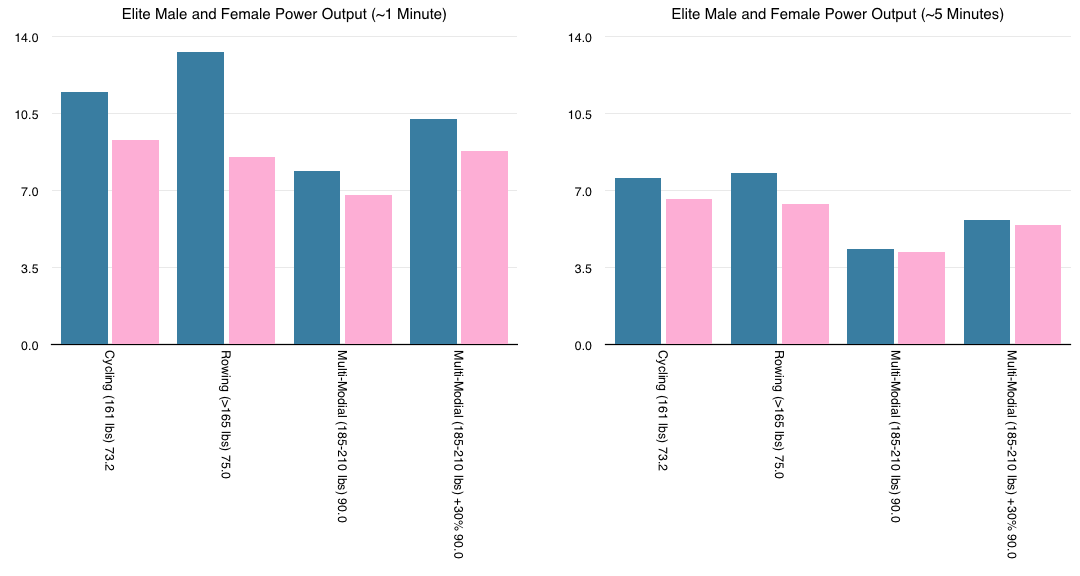
Observation #1: For men, rowing allowed for the most power production during the 1-min and 5-min events. While cycling allowed for the most power production in the 30-min event for men and for all three durations in women.
Observation #2: If you remember from last month, one of the major problems with weight training power calculations is that they fail to account for eccentric power. This means that upwards of 30% of the true power output can be missed (8). As you can see, we added an additional measure to the comparison – “Multimodal +30%.” Upping the Crossfit numbers by the 30% estimate made a huge difference in our calculations for the 1-min and 5-min events – putting them on a similar level with rowing and cycling.
Observations #3: Even with the additional 30%, the power equations we used seem to breakdown drastically in the longer duration multimodal events. There are probably a few reasons for this breakdown. Some of them fall on the limitations of the equations and others are the result of data assumptions. Either way, I would not recommend using the equations and calculators for events longer than 5 minutes. This limits our scope, but definitely improves accuracy.
Observation #4: If we exclude the 30-minute events from our calculations and look at power drop-offs between 1 minute and 5 minutes then the power outputs are relatively similar. For males it is -33.9%, -41.2% and -45% (cycling, rowing and CrossFit, respectively). For females it is -28.9%, -25.1% and -38.1% (cycling, rowing and CrossFit, respectively).
Power-to-Weight Data (Watts/kg)

In my opinion, this is really the holy grail assessment for most athletes – bigger engines in lighter frames. Obviously there are a few exceptions where absolute power trumps relative power (football lineman, strongmen, etc.), but for most tactical athletes more power with less weight is ideal.
Observation #1: Our Multimodal athletes are by far the heaviest. They also (according to our equations) have the lowest 1-min and 5-min power outputs, this drastically lowers their power-to-weight ratios.
Observation #2: Although I am convinced that power-to-weight ratios are vital for a tactical athlete’s performance I am confident that there is a minimum weight, below which is sub-optimal. For example, in cycling the ideal hill climber will weigh about 2.2 pounds for every inch of height. That means, if you are an average size American male (5 feet 9 inches), your ideal weight for hill climbing will be just over 150 lbs (9).
Based on what we know about rucking, an athlete’s weight is key to their performance (UCCS Ruck Study). So, 150 lbs might be ideal for a cyclist, but would likely negatively impact an athlete’s ability to carry heavy loads, which is crucial for a tactical athlete. It is also worth pointing out that the top ten male athletes at the 2015 Crossfit games averaged 5 feet 9.2 inches (close to average American height). However, the average weight was 191.8 lbs, nearly 40 lbs heavier than the ideal weight for a cyclist.
Observation #3: Male rowers and cyclists are able to produce much higher power-to-weight ratios during the shorter duration events when compared to females. These margins decrease as the event times increase.
Observation #4: Male and female power-to-weight ratios are much closer in the multi-modal, Crossfit events. However, females typically use lighter weights which allows them to move faster. This increased speed has a greater impact on power. Never-the-less, elite male and female power-to-weight ratios are nearly identical in “Jackie” and “Murph”.
Implications
Remember, the goal here is to develop a work capacity standard for tactical athletes. So, what do our comparisons tell us about using power to develop a possible standard?
1. Based on the inherent limitations of the power calculations we need to focus on events of around 1-7 minutes.
2. A proposed standard should likely be categorized by weight (i.e. power to weight ratio). This would allow for similar standards for males and females. However, there should either be a minimum weight standard, or slightly higher power to weight ratios for smaller athletes due to the importance of weight for the tactical athlete.
3. The elite power outputs presented in the article are pretty far outside the abilities of most athletes so we will need to scale down the standards.
What’s Next?
We will throw together what we have learned about power and the results from our Work Capacity survey and offer a few suggestions.
References
- Carmelo Bosco PL, and Paavo V. Komi. A Simple Method for Measurement of Mechanical Power in Jumping. European Journal of Applied Physiology and Occupational Physiology 50: 273-282, 1983.
- http://home.trainingpeaks.com/blog/article/power-profiling. Accessed 13 August, 2015.
- Karduna AR. Introduction to Biomechanical Analysis, in: Biomechanical Principles. p 20.
- Keytel LR, Goedecke, J.H., Noakes, T.D., Hiiloskorpi, H., Laukkanen, R., van de Merwe, L., Lmabert, E.V. Predictions of energy expenditure from heart rate monitoring during submaximal exercise. Journal of Sports Science, 2005.
- Knudson DV. Correcting the use of the term “power” in the strength and conditioning literature. Journal of Strength and Conditioning Research 23: 1902-1908, 2009.
- Lakomy HKA. Laboratory measurement of human power output during maximum intensity exercise. Physical Education 28, 1993.
- Steiler S. Physiology of an Elite Rower. 1996.
- Houglum, P.A., Dolores, B.B. Brunnstrom’s Clinical Kinesiology. F.A. Davis Company. Philadelphia, PA. 2012
- Hughes, John. “Training for Economy.” http://www.ultracycling.com/training/economy.html. Accessed: September 18, 2010.
- “What’s a good Grace (CrossFit) time?” http://www.cebul.la/whats-a-good-grace-crossfit-time/. Accessed: September 22, 2015.
Power Calculator Websites:
http://www.catalystathletics.com/resources/power-output
http://www.concept2.com/indoor-rowers/training/calculators/watts-calculator
http://www.topendsports.com/testing/running-power.htm